Figure
1.
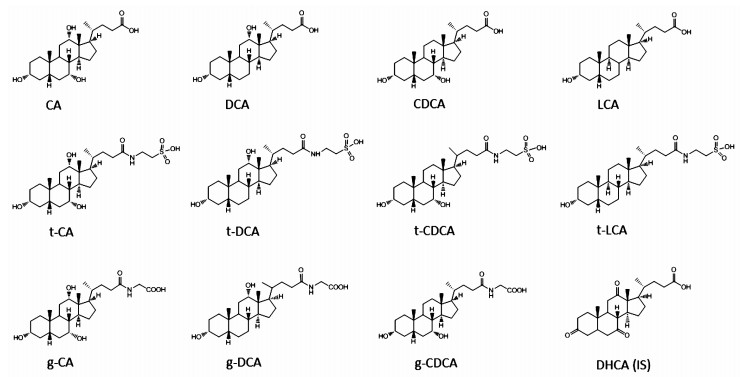
Chemical structures of BAs and DHCA as internal standard (IS)
| Citation: |
CHEN Ying, HU Xiao-Ru, CHENG Xian-Long, MA Shuang-Cheng, RAN Qing-Sen, YANG Qing, QIANG Wei-Jie, DAI Zhong, ZHU Xiao-Xin. Quantitative Comparison of Bile Acid Distribution and Intestinal Transport from Native Cow-bezoar and Artificial and in vitro Cultured Substitutes using Caco-2 Cell Monolayer Model[J]. Digital Chinese Medicine, 2018, 1(4): 261-271.

|
Naturally occurring cow-bezoar (Niu Huang, 牛黄), which is the dry gall-stone of Bos Taurus domesticus Gmelin, has incomparable therapeutic effects and thus has been one of the most valuable traditional Chinese medicines (TCM) since a long time in China. According to TCM theory, it can clear the heart and open orifices, eliminate phlegm, and extinguish wind, and is commonly used to extinguish wind and stop convulsions [1]. Thus, it is used alone or with other herbs in TCM prescriptions to treat stroke, convulsions, and delirious seizure in the clinic. Although the price of natural cow-bezoar (NCB) is consistently increasing, it is widely used in more than 600 Chinese patent drugs because of its incomparable therapeutic effects. However, the availability of NCB is limited.
To address the problem of reduced supply and increased demand, three substitutes for NCB, artificial cow-bezoar (ACB), in vitro cultured cow-bezoar (Ivt-CCB), and in vivo cultured cow-bezoar (Ivv-CCB) have been developed [1, 2]. In the late 1960s, ACB was produced by Chinese scientists by mixing cattle bile, cholic acid, taurine, hyodeoxycholic acid, and bilirubin to mimic NCB [3]. ACB is widely considered to have some of the same effects as NCB, including resolving summer heat and phlegm and treating sore throat, mouth ulcer, and abscess, among other conditions. As a first-class new drug in China, Ivt-CCB was developed in 1997 by simulating gallstone formation [4]. First, cattle bile was collected from healthy cattle. After adding Escherichia coli to the fresh bile, fermentation was conducted for 3~5 d. In this in vitro bacterial infection method, conjugated bile acids (BAs) were degraded to unconjugated BAs, disrupting the stability of colloid in bile solution. Next, stable micelles induced by acids aggregated and formed the core of the gallstone. The core rotated in a rotary shaker, aggregating the BAs, calcium bilirubin, calcium cholate, and other materials in the bile. The hardened growing core was named as Ivt-CCB and showed identical pharmacological effects as NCB in Chinese pharmacopoeia. In a manner similar to the production of artificial pearls, a nucleus material was implanted into the gallbladder of healthy cattle. Approximately one year later, the nucleus was removed by operation and cleaned. After drying, the yellow external layer of the core was scraped off [5]. These dried gallstones are the most optimal substitute for NCB. However, because of its high cost, its availability in the Chinese market is limited.
In the ordinance for bezoar and its substitutes issued by the China Food and Drug Administration [6], both Ivt-CCB and Ivv-CCB, rather than ACB, are considered as equivalent to NCB in the Chinese patent drugs for emergency use and treatment of severe diseases to ensure drug quality. Many studies have revealed that the main active components of NCB and its three substitutes are BAs, a group of steroids bearing a carboxyl group at the C-17 side chain [7]. BAs include taurocholic acid, glycocholic acid, cholic acid, deoxycholic acid and chenodeoxycholic acid. Previous studies showed that NCB and its substitutes contained the same types of Bas [8]. However, the relative ratios of unconjugated BAs, glycine-conjugated BA and taurine-conjugated BA varied remarkably among different species of cow-bezoar. It has been reported that unconjugated BA and conjugated BA have different or even opposite pharmacodynamic effects [9]. Thus, studies are needed to evaluate the differences between the absorption and translocation of BA from different bezoars. Because the BAs are also present in human bile, endogenous substances in the plasma interfere with the determination of BAs from cow-bezoar. A stable and reliable culture model in vitro is useful for these studies. Because the typical small intestinal microvillus and transporter is found in its monolayer, the Caco-2 cell model is one of the most widely used in vitro models for high-throughput analysis of drug permeability and identification of substrates, inhibitors, and inducers of intestinal transporters, particularly P-glycoprotein.
To provide an experimental foundation for NCB and its substitutes, the present study was performed to compare the apparent permeability coefficient value of 8 BAs from NCB, ACB and Ivt-CCB using an in vitro Caco-2 cell monolayer model.
NCB and ACB were provided by the National Institutes for Food and Drug Control (Beijing, China). Ivt-CCB was purchased from Jianmin Dapeng Pharmaceutical (Wuhan, China). Acetonitrile (HPLC grade), formic acid (LCMS grade) and ammonium acetate (LCMS grade) were purchased from Fisher Scientific (Waltham, MA, USA). Ultrapure water was generated with a Milli-Q system (Millipore, Bedford, MA, USA). All other reagents were of analytical grade. Taurine, cholic acid (CA), deoxycholic acid (DCA), taurocholic acid (t-CA), and chenodeoxycholic acid (CDCA) were supplied by the National Institutes for Food and Drug Control. Dehydroxycholic acid (DHCA, internal standard), lithocholic acid (LCA), taurodeoxycholic acid (t-DCA), taurochenodexoycholic (t-CDCA), taurolithocholic acid (t-LCA), glycocholic acid (g-CA), glycodeoxycholic acid (g-DCA), and glycochenodeoxycholic acid (g-CDCA) were purchased from Sigma-Aldrich (St Louis, MO, USA). The chemical structures of BAs are depicted in figure 1.
Caco-2 cells were obtained from the American Type Culture Collection (Manassas, VA, USA). Dulbecco's modified Eagle's medium (DMEM), fetal bovine serum, penicillin-streptomycin, and Hank's balanced salt solution (HBSS) were all purchased from Gibco (Grand Island, NY, USA). Six-well Transwell® plates (0.4 μm pore size, 4.71 cm2, polycarbonate membrane) were purchased from Corning Costar Co. (Corning, NY, USA). All other chemicals and reagents were of analytical grade and obtained from Beijing Chemical Reagent Company (Beijing, China).
A sulforhodamine B assay was used to determine the cytotoxicity of NCB and its substitutes towards Caco-2 cells. The Caco-2 cells were seeded into a 96-well plate at a density of 5 × 10⁴ cells/well in DMEM and cultured at 37℃ for 12 h. Subsequently, the culture medium was replaced with 150 μL of HBSS (pH 7.4) containing NCB, ACB and Ivt-CCB at concentrations of 3.12, 6.25, 12.50, 25.00, 50.00 μg/mL. HBSS (pH 7.4) was employed as a negative control. The plate was incubated at 37℃ for 3 h, after which 25 μL cold 50% (wt/vol) t-CA was added to each well and the plates were incubated at 4℃ for 1 h. After washing the plates four times by submersion in a tub with slow-running tap water, excess water was removed by gently tapping the plate on a paper towel. After the final wash, the plate was air-dried. Next, 50 μL 0.04% (wt/vol) SRB solution was added to each well. The plate was incubated at room temperature for 1 h, and then the plates were quickly rinsed four times with 1% (vol/vol) acetic acid (200 μL) to remove unbound dye. After air-drying the plate, 100 μL of 10 mM Tris base solution (pH 10.5) was added to each well and the plates were shaken for 10 min. Absorbance was measured at 510 nm in a microplate reader (Thermo Electron Co., Ltd.). The cytotoxicity of NCB, ACB and Ivt-CCB at different concentrations was calculated as the percentage of the absorbance relative to that of the negative control.
Caco-2 cells were cultured in DMEM containing 10% fetal bovine serum, 1% nonessential amino acids, L-glutamine (4 mM), penicillin (100 IU/mL) and streptomycin (100 μg/mL). The cells were incubated at 37℃ in a humidified atmosphere of 5% CO2 in air and seeded into collagen-coated inserts at a density of 5 × 10⁵ cells/insert. The cells were cultured for 21 days and the medium was changed every day. The transepithelial electrical resistance (TEER) value was used to monitor the integrity of the monolayer. The TEER value was given by
The warmed HBSS at 37℃ was used as a transport buffer for bidirectional transport studies, which included an absorption transport study from the apical (A) to basolateral (B) side and secretion transport study from the B to A side. HBSS solution (1.5 mL) containing NCB, ACB, and Ivt-CCB (50 μg/mL) was loaded into the A or B side, and 2.6 mL of blank HBSS was placed into the B or A side. Aliquots of 0.5 mL samples were collected from the receiver chamber at different time intervals (30, 60, 90, 120, 150 and 180 min) after loading. After each sampling, an equal volume of blank HBSS was replaced. All collected samples were stored at -20℃ until analysis.
All samples were freeze-dried after spiking with 1000 μL DHCA as an IS (40 ng/mL). The sample was reconstituted in 400 μL of 2% acetonitrile aqueous solution followed by centrifugation at 13, 000 rpm at 4℃ for 20 min. The supernatant was transferred to an auto-sampler vial, and an aliquot of 10 μL was injected into the UPLC-MS/MS system for analysis.
Analysis was performed using a Waters Xevo TQ MS system (Waters, Milford, MA, USA). Masslynx software (version 4.1) was used for data acquisition and processing. The analytical column was an Acquity UPLC HSS T3 (2.1 × 100 mm; 1.8 μm) (Waters) maintained at 40℃. The mobile phases were constitutive of 10 mmol/L ammonium acetate in aqueous (A) and a mixture of acetonitrile and methanol (3 : 1) (B), both of which contained 0.1% (v/v) formic acid. The linear gradient was set as follows: 2% B at 0 min, 15% B at 1 min, 40% B at 4 min, 60% B at 10 min, 95% B at 14 min, 95% B at 22 min and 2% B at 22.5 min for 5 min of equilibration. The flow rate was set at 0.3 mL/min. The auto-sampler was fixed at 4℃ and the injection volume was 10 μL per analysis. Electrospray ionization was performed in negative ion mode. The mass spectrometer (MS) source parameters were set as follows: source temperature 500℃, nebulizer gas (nit rogen) flow rate of 7.0 L/min, capillary voltage of 2.0 kV, cone voltage of 42 V, and radio frequency voltage at 0.2 V. The dwell time was 10 ms. Analysis was performed in multiple reaction monitoring (MRM) mode. The MRM of each compound was predetermined by MS/MS analysis (Table 1).
| BAs | RT (min) |
Precursor ion (m/z) |
Product ion (m/z) |
Cone (V) |
Collision Energy (V) |
Regression equations | r2 | Linear range (ug/mL) |
| t-CA | 6.94 | 514.0 | 80.0 | 96 | 62 | Y= 38.374X- 1.6860 | 0.9985 | 0.003~1.800 |
| DHCA (IS) | 7.07 | 401.1 | 331.1 | 12 | 18 | - | - | - |
| t-CDCA | 8.59 | 498.2 | 80.1 | 52 | 65 | Y= 57.142X+ 0.5027 | 0.9993 | 0.001~0.870 |
| g-CA | 8.57 | 464.0 | 73.9 | 50 | 50 | Y= 75.748X+ 5.0518 | 0.9998 | 0.001~2.190 |
| t-DCA | 9.08 | 498.2 | 80.1 | 52 | 62 | Y= 62.177X+ 2.6946 | 0.9987 | 0.002~1.340 |
| g-CDCA | 10.85 | 448.0 | 73.9 | 80 | 40 | Y= 166.18X+ 4.5664 | 0.9977 | 0.001~0.975 |
| CA | 11.02 | 407.2 | 343.0 | 80 | 48 | Y= 12.157X+ 0.1901 | 0.9985 | 0.001~2.060 |
| t-LCA | 11.09 | 482.3 | 80.1 | 80 | 58 | Y= 59.709X+ 0.0415 | 0.9983 | 0.0002~0.163 |
| g-DCA | 11.36 | 448.0 | 73.9 | 80 | 45 | Y= 133.97X+ 3.0225 | 0.9998 | 0.0005~0.920 |
| CDCA | 12.96 | 391.0 | 391.0 | 80 | 10 | Y= 1290.5X+ 4.0885 | 0.9984 | 0.001~2.030 |
| DCA | 13.19 | 391.0 | 391.0 | 80 | 30 | Y= 111.64X+ 4.1076 | 0.997 | 0.001~2.190 |
| LCA | 14.47 | 375.0 | 375.0 | 80 | 10 | Y= 613.87X+ 3.4171 | 0.9985 | 0.003~0.816 |
 DownLoad:
CSV
DownLoad:
CSV
The intra-day and inter-day accuracy and precision were determined by analyzing five replicates (n = 5) of 3 quality control samples on a single assay day and each of three separate days. Repeatability and precision were respectively assessed using relative standard deviation (%RSD), and accuracy was measured in triplicate. The recovery at the three concentration levels was determined in five replicates.
The matrix effect was measured by comparing the peak area obtained in blank HBSS with that of the standard, both reconstituted in the mobile phase at an equivalent concentration.
The stock solutions of BAs (0.4 mg/mL) were prepared separately in methanol-water (1 : 1, v/v). The stock solutions were stored at -20℃ and found to be stable for at least 6 months. The working solutions were stable through 10 days when stored at 4℃ and 37℃ for 24 h.
The apparent permeability coefficient (Papp) was calculated as follows: Papp = (dC/dt × V)/(A × C), where dC/dt is the rate of the accumulated BA concentration change in the receiver chamber over time; V is the volume of the receiver chamber; A is the surface area of the cell monolayer (4.7 cm2); and C is the initial concentration in the donor solution. The efflux ratio was calculated as follows: Efflux ratio = Papp (B→A)/Papp (A→B).
All data were expressed as the mean ± SD (n = 5). Statistical differences were evaluated by analysis of variance using the SPSS 16.0 software (SPSS, Inc., Chicago, IL, USA). The results were considered significant at P < 0.05.
The cytotoxicity of NCB, ACB and Ivt-CCB towards Caco-2 cells was tested by the SRB assay to establish appropriate loading concentrations for transport studies. Compared to the negative control, there was no significant decrease in the percentage of absorbance observed at all tested NCB, ACB and Ivt-CCB concentrations from 3.12 to 50 μg/mL. These results indicated that NCB, ACB and Ivt-CCB were nontoxic towards Caco-2 cells at these concentrations. To maximize the concentration of BAs from receiver solution in the Caco-2 cell monolayer model, 50 μg/mL was used as the working concentration in the donor chamber.
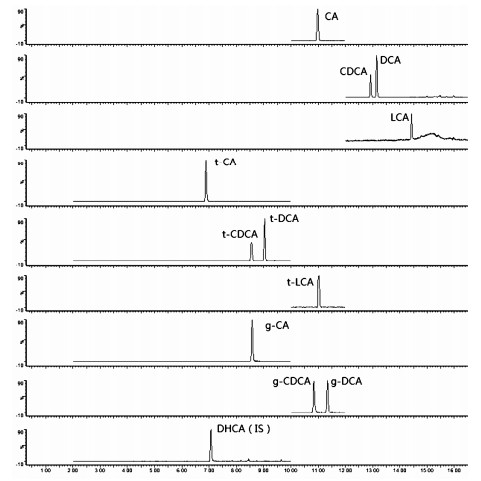
BAs are steroids consisting of three cyclohexanes and one cyclopentane. BAs are isomers with similar structures and polarities, making their separation difficult. First, different HPLC columns, including YMC ODS-A, BEH C18, Eclipse XDB-C18 and HSS T3, were tested and HSS T3 was selected for use. Many solvent systems were tested and acetonitrile-methanol-water was employed. The linear gradient elution used for separation. According to previous studies [10, 11], the mobile phase containing formic acid in the ammonium acetate buffers was suitable for chromatographic separation and was highly sensitive for MS detection. The typical retention times were shown in table 1.
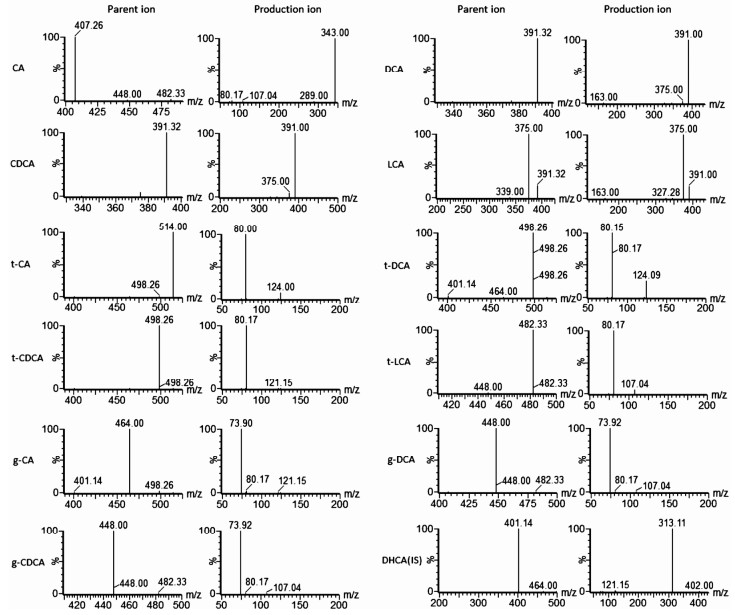
In the present study, the MS conditions were optimized by injection of standards into the ESI source. The BAs analyzed in this study have similar structures. They were detected in negative ionization mode with their carboxylic acid moiety. The cone voltage was optimized for each compound in MS scan mode and the collision energy was optimized in daughter scan mode. Consistent with previous reports, MRM transitions for conjugated BAs were divided according to the conjugated salt type, including taurine-BA series (m/z 498 to 80, m/z 514 to 80 and m/z 482 to 80) and glycine-BA series (m/z 464 to 73.9 and m/z 448 to 73.9). For unconjugated BAs, the carboxylate portion was lost to give an MRM m/z 407 to 343 and m/z 401.1 to 313.1. For other unconjugated BAs, molecular ions were employed as both precursor and product ions. The collision energy was optimized for all pairs, which was shown in table 1. Figure 2 showed a typical MRM chromatogram of each component. Product ion mass spectra of BAs and IS in negative mode were shown in figure 3.
The results showed that all components at high and low concentrations could be detected, and no interference peaks were observed in the blank solution. The peak areas of the chromatogram for each component were compared before and after addition to HBSS solution. The matrix effects were all less than 1% for both BAs and IS. As shown in table 1, the calibration curves of BAs were linear over the studied concentration range from 10 to 2000 ng/mL, with a correlation coefficient of 0.9970 for all BAs.
The results of intra-day and inter-day precision and accuracy of BAs in HBSS were summarized in table 2. The RSD values were below 10.0%, indicating acceptable precision of the methods. The precisions (RSD %, n = 5) at three concentration levels were 0.7%~8.7% for intra-day and 2.0%~7.6% for inter-day precision. The corresponding accuracy was calculated as the percent bias, which ranged from 82.7% to 105.2% for both intra-day and inter-day precision.
| Bile acids | Concentration (μg/mL) |
Intra-day (n= 5) | Inter-day (n=5, 3 d) | ||
| Precision (RSD %) |
Accuracy (Recovery %) |
Precision (RSD %) |
Accuracy (Recovery %) |
||
| t-CA | 0.006 | 5.3 | 93.9 | 6.9 | 106.1 |
| 0.029 | 4.1 | 105.2 | 4.5 | 97.8 | |
| 0.145 | 3.5 | 101.3 | 3.8 | 102.5 | |
| t-CDCA | 0.003 | 6.8 | 93.3 | 3.5 | 90.5 |
| 0.014 | 3.5 | 99.2 | 2.9 | 101.2 | |
| 0.070 | 3.0 | 101.5 | 5.7 | 102.8 | |
| g-CA | 0.007 | 3.6 | 93.4 | 6.0 | 96.1 |
| 0.035 | 3.2 | 96.4 | 4.4 | 97.5 | |
| 0.175 | 1.6 | 100.4 | 3.1 | 102.3 | |
| t-DCA | 0.004 | 4.5 | 90.5 | 4.3 | 91.4 |
| 0.021 | 1.9 | 98.3 | 2.0 | 98.6 | |
| 0.107 | 2.5 | 102.7 | 3.4 | 97.0 | |
| g-CDCA | 0.003 | 5.8 | 92.4 | 6.4 | 92.6 |
| 0.016 | 1.3 | 100.5 | 4.5 | 95.8 | |
| 0.078 | 2.1 | 101.3 | 3.2 | 98.9 | |
| CA | 0.007 | 3.3 | 94.3 | 4.9 | 92.8 |
| 0.035 | 3.2 | 102.3 | 2.7 | 101.4 | |
| 0.176 | 2.8 | 103.3 | 3.6 | 97.6 | |
| t-LCA | 0.0005 | 8.7 | 85.6 | 5.6 | 89.8 |
| 0.003 | 2.0 | 95.5 | 3.5 | 95.4 | |
| 0.013 | 1.0 | 103.1 | 3.2 | 98.4 | |
| g-DCA | 0.003 | 6.5 | 93.6 | 6.1 | 86.1 |
| 0.015 | 2.7 | 103.9 | 3.5 | 95.7 | |
| 0.074 | 1.0 | 100.3 | 3.2 | 98.1 | |
| CDCA | 0.006 | 5.7 | 93.2 | 5.0 | 82.4 |
| 0.032 | 1.7 | 97.5 | 3.6 | 94.5 | |
| 0.162 | 0.7 | 100.4 | 2.4 | 97.9 | |
| DCA | 0.007 | 4.7 | 94.7 | 6.2 | 93.1 |
| 0.035 | 2.2 | 99.0 | 5.8 | 95.7 | |
| 0.175 | 2.5 | 102.7 | 4.1 | 94.9 | |
| LCA | 0.003 | 6.2 | 91.7 | 7.6 | 82.7 |
| 0.013 | 4.4 | 105.2 | 4.5 | 91.1 | |
| 0.065 | 3.8 | 99.9 | 2.3 | 96.9 | |
DownLoad:
CSV
Recoveries were calculated using the formula: recovery (%) = concentration found/concentration spiked × 100. As summarized in table 3, the recovery of each component ranged from 95.6% to 117.6% at three concentration levels (approximately equivalent to 0.8-, 1.0- and 1.2-fold the concentration of the matrix).
| BAs | Original (μg/ml) |
Spiked (μg/ml) |
Found (μg/ml) |
Recovery (%) |
Mean (%) |
RSD (%) |
| t-CA | 0.2266 | 0.1718 | 0.4057 | 104.2 | 101.3 | 4.7 |
| 0.2346 | 0.2148 | 0.4403 | 95.8 | |||
| 0.2260 | 0.2577 | 0.4938 | 103.9 | |||
| t-CDCA | 0.0130 | 0.0098 | 0.0247 | 119.8 | 116.4 | 6.2 |
| 0.0134 | 0.0122 | 0.0266 | 108.1 | |||
| 0.0130 | 0.0146 | 0.0307 | 121.3 | |||
| g-CA | 0.2023 | 0.1541 | 0.3804 | 115.6 | 115.1 | 2.1 |
| 0.2094 | 0.1926 | 0.4353 | 117.3 | |||
| 0.2018 | 0.2311 | 0.4617 | 112.5 | |||
| t-DCA | 0.0689 | 0.0537 | 0.1294 | 112.7 | 100.1 | 10.9 |
| 0.0713 | 0.0671 | 0.1347 | 94.5 | |||
| 0.0687 | 0.0805 | 0.1437 | 93.2 | |||
| g-CDCA | 0.0375 | 0.0281 | 0.0668 | 104.4 | 95.6 | 8.0 |
| 0.0388 | 0.0351 | 0.0712 | 92.3 | |||
| 0.0374 | 0.0421 | 0.0754 | 90.2 | |||
| CA | 0.4779 | 0.3530 | 0.8831 | 114.8 | 116.6 | 2.2 |
| 0.4946 | 0.4412 | 1.0223 | 119.6 | |||
| 0.4766 | 0.5294 | 1.0875 | 115.4 | |||
| t-LCA | 0.0010 | 0.0008 | 0.0020 | 126.7 | 117.6 | 7.0 |
| 0.0011 | 0.0010 | 0.0021 | 110.6 | |||
| 0.0010 | 0.0012 | 0.0024 | 115.4 | |||
| g-DCA | 0.0357 | 0.0265 | 0.0612 | 96.6 | 104.8 | 8.3 |
| 0.0369 | 0.0331 | 0.0713 | 103.9 | |||
| 0.0356 | 0.0397 | 0.0808 | 113.9 | |||
| DCA | 0.1585 | 0.1192 | 0.2831 | 104.5 | 99.4 | 4.9 |
| 0.1641 | 0.1491 | 0.3054 | 94.8 | |||
| 0.1581 | 0.1789 | 0.3350 | 98.9 | |||
| CDCA | 0.0587 | 0.0455 | 0.1133 | 120.1 | 110.4 | 7.8 |
| 0.0607 | 0.0569 | 0.1218 | 107.5 | |||
| 0.0585 | 0.0682 | 0.1291 | 103.5 | |||
| LCA | 0.0146 | 0.0111 | 0.0253 | 96.5 | 98.1 | 7.6 |
| 0.0151 | 0.0139 | 0.0278 | 91.5 | |||
| 0.0146 | 0.0166 | 0.0322 | 106.2 |
DownLoad:
CSV
No significant degradation of BAs was observed in HBSS buffer at 37℃ for at least 3 h. All BAs were also stable after one freeze-thaw cycle and in the prepared HBSS sample solution when placed in the auto-sampler at 4℃ for over 24 h.
As shown in table 4, 11 BAs in NCB, ACB and Ivt-CCB were quantitatively determined by LC/MS/MS analysis. The total amount of the 11 BAs detected in NCB, ACB and Ivt-CCB was 33.137%, 43.568% and 49.012%, respectively. CA and its conjugates t-CA and g-CA were the major chemical constituent groups in the three crude drugs. CA-groups accounted for 22.515% in NCB, 33.445% in ACB and 29.472% in Ivt-CCB. The total amount of the second principal component groups DCA and its derivatives was 7.673% in NCB, 7.274% in ACB and 14.694% in Ivt-CCB. The results showed that the relative percentages of the four BA groups, CA, DCA, CDCA and LCA, varied significantly among the 3 cow-bezoars. However, the differences were not significant and may not be useful for their identification among NCB and its substitutes.
| Conjugates | BAs | NCB (%) | ACB (%) | Ivt-CCB (%) | |||
| Percentage | Amount | Percentage | Amount | Percentage | Amount | ||
| Unconjugates | CA | 7.346 | 12.885 | 24.452 | 31.379 | 22.347 | 39.667 |
| DCA | 3.891 | 4.694 | 12.980 | ||||
| CDCA | 1.617 | 2.176 | 4.061 | ||||
| LCA | 0.031 | 0.057 | 0.280 | ||||
| Taurine-conjugates | t-CA | 7.933 | 11.034 | 3.933 | 5.717 | 3.907 | 5.342 |
| t-DCA | 2.249 | 1.475 | 1.142 | ||||
| t-CDCA | 0.830 | 0.276 | 0.268 | ||||
| t-LCA | 0.022 | 0.034 | 0.025 | ||||
| Glycine-conjugates | g-CA | 7.236 | 9.218 | 5.060 | 6.472 | 3.218 | 4.003 |
| g-DCA | 1.533 | 1.105 | 0.572 | ||||
| g-CDCA | 0.449 | 0.307 | 0.213 | ||||
DownLoad:
CSV
However, the relative ratios of unconjugated BAs/taurine : BAs/glycine : BAs were approximately 13 : 11 : 9 in NCB, 31 : 6 : 6 in ACB, and 40 : 5 : 4 in Ivt-CCB. Naturally occurring cow-bezoar contained more detectable amounts of taurine- and glycine-conjugated BAs than ACB and Ivt-CCB. The percentages of unconjugated BAs were significantly higher in the two substitutes than in NCB. The ratios were relatively consistent among the three crude drugs and might be used to distinguish costly NCB and from the inexpensive substitute ACB.
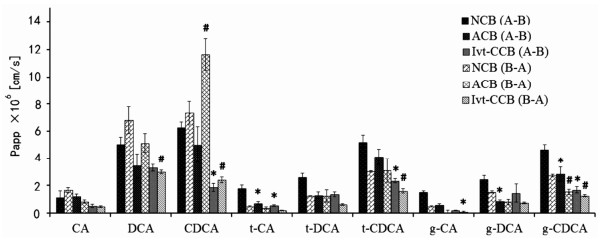
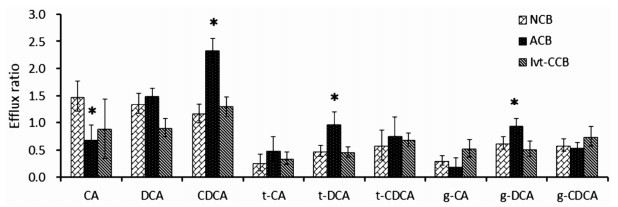
The 11 BAs in the receiver chamber were identified by UPLC-MS/MS. The concentrations of LCA and t-LCA were below their detection limits. The results in figure 4 showed that Papp values of DCA, CDCA, t-CDCA, and g-CDCA were above 2.5 × 10⁻⁶ cm/s, indicating the high permeability of these BAs in the Caco-2 cell monolayer. Papp values of the same BA varied among NCB, ACB and Ivt-CCB. This variation might be related to the concentrations of 11 BAs in the loaded chamber. As shown in figure 4, the bi-director transport rates of most BAs in ACB and Ivt-CCB decreased compared to that in NCB. Only the transport rate of CDCA improved significantly from B to A. Although the change in Papp was observed in the Caco-2 cell model, the reason for the changes was not known and requires further analysis. The in vitro efflux ratio (ER) can predict the transport mechanism of P-gp-, BCRP- and MRP2-mediated efflux. As shown in figure 5, the ER values of CA, CDCA, t-DCA, g-DCA and g-CDCA significantly changed between NCB and ACB. However, there were no significant differences in the ER of the 11 BAs between NCB and Ivt-CCB. Transport characteristics of BAs in Ivt-CCB were similar to those in NCB. Our results demonstrated that the transport parameters, particularly ER, could be used to distinguish NCB and ACB.
In this study, a sensitive and specific LC/MS/MS method was developed to identify the 11 BAs. The present method was successfully applied to compare the distribution and intestinal transport in the Caco-2 cell monolayer model. The results showed that the distribution of BAs in NCB was significantly different from that in ACB and Ivt-CCB. The percentages of the conjugated BAs were significantly higher in NCB than in its two substitutes. In the Caco-2 cell model, the transport characteristics of BAs in Ivt-CCB were more like those in NCB than in ACB. The ER of BAs may be an important factor for distinguishing NCB and ACB.
We thank for the funding support from the Youth Development Research Foundation of NIFDC (2014A1), National Science and Technology Major Project (2017ZX09101002-002-008), and the National Natural Science Foundation of China (No. 81403171 and No. 81603517).
The authors declare no conflict of interest.
| [1] |
Chinese Pharmacopoeia Commission, "Pharmacopoeia of the People's Republic of China, " Vol.1, People's Medical Science Publisher, Beijing, China, 2015: 70.
|
| [2] |
LUO X M, DU W, ZHANG H C, et al. Analysis and discussion on standards and supervision of preparations containing calculus bovis. Chinese Traditional Patent Medicine, 2009, 31(3): 444-449.
|
| [3] |
CAI H J, QIU F Z, LIU R Z. Studies on the pharmacy of in-vitro cultivated calculus bovis. Chinese Journal of Natural Medicines, 2004, 6(2):335-338. http://www.wanfangdata.com.cn/details/detail.do?_type=perio&id=zgtryw200406003
|
| [4] |
WU J X, ZHANG Z M, WANG Y S, et al. Study on the cultivation of bezoar in cow's body by Injection. Journal of Traditional Chinese Medicine, 1993, 10: 10-13.
|
| [5] |
China Food and Drug Administration, "Notice on the use of bezoar and its substitutes". 2004.
|
| [6] |
NAGANA G, SHANAIAH N, COOPER A, et al. Visualization of bile homeostasis using 1H-NMR spectroscopy as a route for assessing liver cancer. Lipids, 2009, 44(9): 27-35. http://www.wanfangdata.com.cn/details/detail.do?_type=perio&id=1533acaa32e72487190826d073829b45
|
| [7] |
HU X R, SUN S L, FU X T, et al. Study on fingerprint and quantitative analysis ofCalculus Bovis and its substitutes. J. Pharmaceutical Analysis, 2018, 38(4):648-656.
|
| [8] |
TAKAHASHI K, AZUMA Y, SHIMADA K, et al. Quality and safety issues related to traditional animal medicine: role of taurine. Journal of Biomedical Science, 2010, 17 (Suppl 1):S44-53. doi: 10.1186/1423-0127-17-S1-S44
|
| [9] |
QIAO X, YE M, PAN D L, et al. Differentiation of various traditional Chinese medicines derived from animal bile and gallstone: Simultaneous determination of BAs by liquid chromatography coupled with triple quadrupole mass spectrometry. Journal of Chromatography A, 2011, 1218 (1):107-117. http://www.ncbi.nlm.nih.gov/pubmed/21111425
|
| [10] |
FENG C, LI X, ZHANG C, et al. Development of a rapid and simple LC-MS/MS method for identification and quality control of natural Calculus bovis and Calculus bovissativus. Analytical methods, 2015, 7(18):7606-7617. doi: 10.1039/C5AY01288K
|
| [11] |
TAVELIN S, MILOVIC V, OCKLIND G, et al. Conditionally immortalized epithelial cell line for studies of interstinal drug transport. Journal of Pharmacology & Experimental Therapeutics, 1999, 290(3):1212-1221. http://cn.bing.com/academic/profile?id=046ed02671cbc5d09ababf92bbf4f03a&encoded=0&v=paper_preview&mkt=zh-cn
|
| 1. | Xu, K., Deng, B., Jia, T. et al. A review of the Bovis Calculus’s intervention mechanism and clinical application in ischemic stroke. Frontiers in Pharmacology, 2024, 15: 1510779. DOI:10.3389/fphar.2024.1510779 |
| 2. | Tang, Y., Han, Z., Zhang, H. et al. Characterization of Calculus bovis by principal component analysis assisted qHNMR profiling to distinguish nefarious frauds. Journal of Pharmaceutical and Biomedical Analysis, 2023, 228: 115320. DOI:10.1016/j.jpba.2023.115320 |
| 3. | Ma, Y., Shan, K., Huang, Z. et al. Bile Acid Derivatives Effectively Prevented High-Fat Diet-Induced Colonic Barrier Dysfunction. Molecular Nutrition and Food Research, 2023, 67(10): 2200649. DOI:10.1002/mnfr.202200649 |
Figures(5) / Tables(4)
| BAs | RT (min) |
Precursor ion (m/z) |
Product ion (m/z) |
Cone (V) |
Collision Energy (V) |
Regression equations | r2 | Linear range (ug/mL) |
| t-CA | 6.94 | 514.0 | 80.0 | 96 | 62 | Y= 38.374X- 1.6860 | 0.9985 | 0.003~1.800 |
| DHCA (IS) | 7.07 | 401.1 | 331.1 | 12 | 18 | - | - | - |
| t-CDCA | 8.59 | 498.2 | 80.1 | 52 | 65 | Y= 57.142X+ 0.5027 | 0.9993 | 0.001~0.870 |
| g-CA | 8.57 | 464.0 | 73.9 | 50 | 50 | Y= 75.748X+ 5.0518 | 0.9998 | 0.001~2.190 |
| t-DCA | 9.08 | 498.2 | 80.1 | 52 | 62 | Y= 62.177X+ 2.6946 | 0.9987 | 0.002~1.340 |
| g-CDCA | 10.85 | 448.0 | 73.9 | 80 | 40 | Y= 166.18X+ 4.5664 | 0.9977 | 0.001~0.975 |
| CA | 11.02 | 407.2 | 343.0 | 80 | 48 | Y= 12.157X+ 0.1901 | 0.9985 | 0.001~2.060 |
| t-LCA | 11.09 | 482.3 | 80.1 | 80 | 58 | Y= 59.709X+ 0.0415 | 0.9983 | 0.0002~0.163 |
| g-DCA | 11.36 | 448.0 | 73.9 | 80 | 45 | Y= 133.97X+ 3.0225 | 0.9998 | 0.0005~0.920 |
| CDCA | 12.96 | 391.0 | 391.0 | 80 | 10 | Y= 1290.5X+ 4.0885 | 0.9984 | 0.001~2.030 |
| DCA | 13.19 | 391.0 | 391.0 | 80 | 30 | Y= 111.64X+ 4.1076 | 0.997 | 0.001~2.190 |
| LCA | 14.47 | 375.0 | 375.0 | 80 | 10 | Y= 613.87X+ 3.4171 | 0.9985 | 0.003~0.816 |
DownLoad:
CSV
| Bile acids | Concentration (μg/mL) |
Intra-day (n= 5) | Inter-day (n=5, 3 d) | ||
| Precision (RSD %) |
Accuracy (Recovery %) |
Precision (RSD %) |
Accuracy (Recovery %) |
||
| t-CA | 0.006 | 5.3 | 93.9 | 6.9 | 106.1 |
| 0.029 | 4.1 | 105.2 | 4.5 | 97.8 | |
| 0.145 | 3.5 | 101.3 | 3.8 | 102.5 | |
| t-CDCA | 0.003 | 6.8 | 93.3 | 3.5 | 90.5 |
| 0.014 | 3.5 | 99.2 | 2.9 | 101.2 | |
| 0.070 | 3.0 | 101.5 | 5.7 | 102.8 | |
| g-CA | 0.007 | 3.6 | 93.4 | 6.0 | 96.1 |
| 0.035 | 3.2 | 96.4 | 4.4 | 97.5 | |
| 0.175 | 1.6 | 100.4 | 3.1 | 102.3 | |
| t-DCA | 0.004 | 4.5 | 90.5 | 4.3 | 91.4 |
| 0.021 | 1.9 | 98.3 | 2.0 | 98.6 | |
| 0.107 | 2.5 | 102.7 | 3.4 | 97.0 | |
| g-CDCA | 0.003 | 5.8 | 92.4 | 6.4 | 92.6 |
| 0.016 | 1.3 | 100.5 | 4.5 | 95.8 | |
| 0.078 | 2.1 | 101.3 | 3.2 | 98.9 | |
| CA | 0.007 | 3.3 | 94.3 | 4.9 | 92.8 |
| 0.035 | 3.2 | 102.3 | 2.7 | 101.4 | |
| 0.176 | 2.8 | 103.3 | 3.6 | 97.6 | |
| t-LCA | 0.0005 | 8.7 | 85.6 | 5.6 | 89.8 |
| 0.003 | 2.0 | 95.5 | 3.5 | 95.4 | |
| 0.013 | 1.0 | 103.1 | 3.2 | 98.4 | |
| g-DCA | 0.003 | 6.5 | 93.6 | 6.1 | 86.1 |
| 0.015 | 2.7 | 103.9 | 3.5 | 95.7 | |
| 0.074 | 1.0 | 100.3 | 3.2 | 98.1 | |
| CDCA | 0.006 | 5.7 | 93.2 | 5.0 | 82.4 |
| 0.032 | 1.7 | 97.5 | 3.6 | 94.5 | |
| 0.162 | 0.7 | 100.4 | 2.4 | 97.9 | |
| DCA | 0.007 | 4.7 | 94.7 | 6.2 | 93.1 |
| 0.035 | 2.2 | 99.0 | 5.8 | 95.7 | |
| 0.175 | 2.5 | 102.7 | 4.1 | 94.9 | |
| LCA | 0.003 | 6.2 | 91.7 | 7.6 | 82.7 |
| 0.013 | 4.4 | 105.2 | 4.5 | 91.1 | |
| 0.065 | 3.8 | 99.9 | 2.3 | 96.9 | |
DownLoad:
CSV
| BAs | Original (μg/ml) |
Spiked (μg/ml) |
Found (μg/ml) |
Recovery (%) |
Mean (%) |
RSD (%) |
| t-CA | 0.2266 | 0.1718 | 0.4057 | 104.2 | 101.3 | 4.7 |
| 0.2346 | 0.2148 | 0.4403 | 95.8 | |||
| 0.2260 | 0.2577 | 0.4938 | 103.9 | |||
| t-CDCA | 0.0130 | 0.0098 | 0.0247 | 119.8 | 116.4 | 6.2 |
| 0.0134 | 0.0122 | 0.0266 | 108.1 | |||
| 0.0130 | 0.0146 | 0.0307 | 121.3 | |||
| g-CA | 0.2023 | 0.1541 | 0.3804 | 115.6 | 115.1 | 2.1 |
| 0.2094 | 0.1926 | 0.4353 | 117.3 | |||
| 0.2018 | 0.2311 | 0.4617 | 112.5 | |||
| t-DCA | 0.0689 | 0.0537 | 0.1294 | 112.7 | 100.1 | 10.9 |
| 0.0713 | 0.0671 | 0.1347 | 94.5 | |||
| 0.0687 | 0.0805 | 0.1437 | 93.2 | |||
| g-CDCA | 0.0375 | 0.0281 | 0.0668 | 104.4 | 95.6 | 8.0 |
| 0.0388 | 0.0351 | 0.0712 | 92.3 | |||
| 0.0374 | 0.0421 | 0.0754 | 90.2 | |||
| CA | 0.4779 | 0.3530 | 0.8831 | 114.8 | 116.6 | 2.2 |
| 0.4946 | 0.4412 | 1.0223 | 119.6 | |||
| 0.4766 | 0.5294 | 1.0875 | 115.4 | |||
| t-LCA | 0.0010 | 0.0008 | 0.0020 | 126.7 | 117.6 | 7.0 |
| 0.0011 | 0.0010 | 0.0021 | 110.6 | |||
| 0.0010 | 0.0012 | 0.0024 | 115.4 | |||
| g-DCA | 0.0357 | 0.0265 | 0.0612 | 96.6 | 104.8 | 8.3 |
| 0.0369 | 0.0331 | 0.0713 | 103.9 | |||
| 0.0356 | 0.0397 | 0.0808 | 113.9 | |||
| DCA | 0.1585 | 0.1192 | 0.2831 | 104.5 | 99.4 | 4.9 |
| 0.1641 | 0.1491 | 0.3054 | 94.8 | |||
| 0.1581 | 0.1789 | 0.3350 | 98.9 | |||
| CDCA | 0.0587 | 0.0455 | 0.1133 | 120.1 | 110.4 | 7.8 |
| 0.0607 | 0.0569 | 0.1218 | 107.5 | |||
| 0.0585 | 0.0682 | 0.1291 | 103.5 | |||
| LCA | 0.0146 | 0.0111 | 0.0253 | 96.5 | 98.1 | 7.6 |
| 0.0151 | 0.0139 | 0.0278 | 91.5 | |||
| 0.0146 | 0.0166 | 0.0322 | 106.2 |
DownLoad:
CSV
| Conjugates | BAs | NCB (%) | ACB (%) | Ivt-CCB (%) | |||
| Percentage | Amount | Percentage | Amount | Percentage | Amount | ||
| Unconjugates | CA | 7.346 | 12.885 | 24.452 | 31.379 | 22.347 | 39.667 |
| DCA | 3.891 | 4.694 | 12.980 | ||||
| CDCA | 1.617 | 2.176 | 4.061 | ||||
| LCA | 0.031 | 0.057 | 0.280 | ||||
| Taurine-conjugates | t-CA | 7.933 | 11.034 | 3.933 | 5.717 | 3.907 | 5.342 |
| t-DCA | 2.249 | 1.475 | 1.142 | ||||
| t-CDCA | 0.830 | 0.276 | 0.268 | ||||
| t-LCA | 0.022 | 0.034 | 0.025 | ||||
| Glycine-conjugates | g-CA | 7.236 | 9.218 | 5.060 | 6.472 | 3.218 | 4.003 |
| g-DCA | 1.533 | 1.105 | 0.572 | ||||
| g-CDCA | 0.449 | 0.307 | 0.213 | ||||
DownLoad:
CSV