ZHAO Ling-Jia, XIA Bo-Hou, LIN Li-Mei, XIONG Su-Hui, TANG Jie, LIAO Duan-Fang. Optimization of Ultrasound-assisted Enzymatic Polysaccharide Extraction from Turpiniae Folium Based on Response Surface Methodology[J]. Digital Chinese Medicine, 2018, 1(3): 239-246.
Citation:
ZHAO Ling-Jia, XIA Bo-Hou, LIN Li-Mei, XIONG Su-Hui, TANG Jie, LIAO Duan-Fang. Optimization of Ultrasound-assisted Enzymatic Polysaccharide Extraction from Turpiniae Folium Based on Response Surface Methodology[J]. Digital Chinese Medicine, 2018, 1(3): 239-246.
ZHAO Ling-Jia, XIA Bo-Hou, LIN Li-Mei, XIONG Su-Hui, TANG Jie, LIAO Duan-Fang. Optimization of Ultrasound-assisted Enzymatic Polysaccharide Extraction from Turpiniae Folium Based on Response Surface Methodology[J]. Digital Chinese Medicine, 2018, 1(3): 239-246.
Citation:
ZHAO Ling-Jia, XIA Bo-Hou, LIN Li-Mei, XIONG Su-Hui, TANG Jie, LIAO Duan-Fang. Optimization of Ultrasound-assisted Enzymatic Polysaccharide Extraction from Turpiniae Folium Based on Response Surface Methodology[J]. Digital Chinese Medicine, 2018, 1(3): 239-246.
Optimization of Ultrasound-assisted Enzymatic Polysaccharide Extraction from Turpiniae Folium Based on Response Surface Methodology
College of Pharmacy, Hunan University of Chinese Medicine, Changsha, Hunan 410208, China
b.
Collaborative Innovation Center for the Protection and Utilization of Chinese Herbal Medicine Resources in Hunan Province, Hunan University of Chinese Medicine, Changsha, Hunan 410208, China
c.
Key laboratory for quality of bulk herbs for Hunan Province, Hunan University of Chinese Medicine, Changsha, Hunan 410208, China
ObjectiveTo optimize the extraction procedure and obtain the maximum total polysaccharide yield from Turpiniae Folium.
MethodsResponse surface methodology (RSM), combining Plackett-Burman design (PBD), steepest ascent method, and Box-Behnken design (BBD), was employed. The significant factors contributing to polysaccharide production were determined by PBD. The path of steepest ascent method was performed to rapidly reach the neighborhood of the optimum region. BBD and RSM were applied to further investigate the mutual interaction between the variables and to define the optimal values.
ResultsThe significant factors contributing to polysaccharide production were enzyme concentration, extraction time, and liquid-to-solid ratio. The optimal conditions for maximal TFP were: enzyme concentration of 2.8 %, extraction time of 41 min, and liquid-to-solid ratio of 27 mL/g. The experimental yield of 3.08% was in good agreement with the model-predicted yield of 3.1% under the optimized conditions.
ConclusionThis study was successfully applied to optimize the extraction conditions of Turpiniae Folium polysaccharide, which can contribute to its further production and application.
Polysaccharides, which are abundant storage carbohydrates in plants, exhibit multiple bioactivities including immunomodulation, anti-oxidation, and anti-cancer activities [1, 2]. Accordingly, polysaccharides have immense potential industrial applications in pharmacy [3] and materials [4], and many botanical polysaccharides are used as healthy foods [5, 6]. Therefore, the increasing demand for botanical polysaccharides triggered our interests in polysaccharide extraction from herbs.
Turpinia arguta (Lindl.) Seem.(Shan Xiang Yuan, 山香圆), a shrubof the family Staphyleaceae, mainly distributed in the southern part of China [7]. Its dried leaves, called Turpiniae Folium (Shan Xiang Yuan Ye, 山香圆叶), have been used traditionally as a Chinese medicine to treat pharyngitis, amygdalitis, and tonsillar abscess [8]. Several works indicated that Turpiniae Folium(Shan Xiang Yuan Ye, 山香圆叶)exerts anti-inflammatory, antibacterial, analgesic, and immunomodulatory activities [9]. Previous phytochemical studies mainly focused on flavonoids and ellagic acid [10]. As an abundant and potential active constituent, Turpiniae Folium polysaccharide (TFP) has promising applications, which may increase research and market demand of TFP. However, studies on TFP extraction and optimization of the extraction process are limited.
Hence, this study was first designed to investigate and optimize the extraction procedure of TFP using design of experiment (DOE).We screened the important variable factors such as enzyme concentration, extraction time, liquid-to-solid ratio, ultrasonic power, extraction temperature, and pH to determine their main effects on the yield of TFP.
2.
Materials and Methods
2.1
Materials and chemicals
Turpiniae Folium (Shan Xiang Yuan Ye, 山香圆叶) was purchased from GaoQiao natural herbal special market (Changsha, China). The sample was identified by Dr. Zhi WANG. Dextrans with different molecular weights were purchased from Sigma-Aldrich Chemical Co. (St. Louis, Mo., USA). All other solvents used for analyses were of analytical grade.
2.2
Preparation of TFP and determination of the yield
The dried TF sample was pulverized by a disintegrator (HX-200A, Yongkang Hardware and Medical Instrument Plant, China) and passed through an 80-mesh screen (Harbin Ouerfu Filter Material Co., Ltd., China) to obtain a powder. The powder was then extracted three times with 80% ethanol at 60 ℃, each for 5 h, to remove lipids, amino acids, monosaccharide, oligosaccharides, some colored materials, and small-molecule materials [11]. The insoluble parts were separated from the solvent by filtration, and dried (60℃, 24 h).
The ultrasound-assisted enzymatic extraction of TFP was performed using an ultrasonic device (KQ-300DE, Kunshan Ultrasonic Instruments Co., Ltd, China). Each defatted sample (1 g) was put into a triangular flask. Then, the extraction was carried out with a designed liquid-to-solid ratio, enzyme concentration, pH, ultrasonic power, extraction time, and temperature. After extraction, the solutions were centrifuged at 5000 rpm for 10 min. The supernatant was collected and concentrated with a rotary evaporator at 50℃ under vacuum. Then, dehydrated ethanol was added to a final concentration of 80% (v/v) (4℃ for 24h). The precipitated polysaccharides were obtained by centrifugation (5000 rpm for 20 min), washed with dehydrated ethanol, and lyophilized to obtain crude polysaccharides. The polysaccharide content was measured by the phenol-sulfuric acid method using D-glucose as a standard [12]. The polysaccharide yield (%) was calculated by the following equation:
2.3
Optimization procedure and experimental designs
2.3.1
Plackett-Burman design (PBD)
The present study was aimed at screening the important variable factors to determine their main effects on the yield of TFP by PBD [13] (designed by the software Minitab 16). This design was applied to evaluate the main effects of the following six-real factors: enzyme concentration (X1), extraction time (X2), liquid-to-solid ratio (X3), ultrasonic power (X4), extraction temperature (X5), and pH (X6). Each independent variable was defined at two levels, a high level (+1) and a low level (-1). Overall, the experimental design included 12 experiments with 3 replications for each, and the averages of the TFP yield were taken as a response (Table 1).
Table
1.
Experimental design and identification of significant variables for TFP production using Plackett-Burman design
Run
X1(%)
X2(min)
X3(mL/g)
X4(W)
X5(℃)
X6
Yield (%)
1
1
15
10
200
30
4
0.28
2
2
35
20
200
30
4
1.85
3
1
35
20
400
30
5
1.21
4
1
35
10
400
60
4
0.89
5
1
15
20
200
60
4
0.84
6
2
35
10
400
60
4
1.75
7
2
35
20
200
60
5
1.51
8
2
15
10
400
30
5
0.72
9
1
35
10
200
30
5
0.50
10
2
15
10
200
60
5
0.80
11
2
15
20
400
30
4
0.88
12
1
15
20
400
60
5
0.78
Effect
0.5039
0.5683
0.3550
0.0728
0.1883
-0.1617
Coefficient
0.2519
0.2842
0.1775
0.0364
0.0942
-0.0808
t-Value
3.75
4.23
2.64
0.54
1.40
-1.2
P-value
0.013*
0.008*
0.046*
0.612
0.220
0.283
Notes: Press = 1.5616, R2 = 89.49%, adj-R2 = 76.89%; *Identified variables with a significant effect on the response (p < 0.05); X1, Enzyme concentration; X2, Extraction time; X3, Liquid-to-solid ratio; X4, Ultrasonic power; X5, Extraction temperature; X6, pH value.
Analysis of variance (ANOVA) was performed to examine whether the studied experimental factors were significant in the performance of the proposed method. An effect was considered significant when it was above the standard error at 95% confidence level (P < 0.05).
2.3.2
Path of steepest ascent method
The path of steepest ascent is a procedure for moving sequentially along the path of steepest ascent to the optimum region, namely, in the direction of the maximum increase in response [14]. The path starts from the design center of the PBD (the screening design) and ends when no further improvement in the response can be achieved. The variables that were predicted to produce the highest the TFP yield were used as a center point for the following optimization experimental design (central composite design).
2.3.3
Box-Behnken design (BBD) and response surface methodology (RSM)
After the screening of variables based on PBD, BBD was used to optimize the selected variables and obtain a quadratic model [15]. The selected variables were studied at three different levels and experiments were performed according to BBD, as shown in Table 2. The statistical software package "Design Expert 8.0.6" was used to analyze the experimental data. Experiments were carried out in triplicate and the average TFP was reported. A second-order polynomial equation, which relates the measured response to the independent variables, was used.
where Y is the TFP yield, βO is the intercept term, βi are the linear coefficients, βii are the quadratic coefficients, βij are the interaction coefficients, and xi and xj are the uncoded independent variables.
The regression coefficients of the linear, quadratic, and interaction terms were determined according to the variable analysis and then used in statistical calculations to generate three-dimensional (3D) surfaces and contour plots from the fitted polynomial equation. The statistical analysis of the model was represented in the form of ANOVA, and P < 0.05 was considered statistically significant.
3.
Results
3.1
Plackett-Burman experimental design
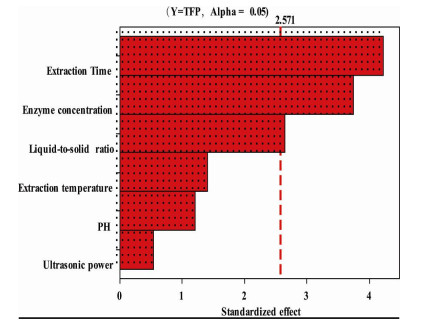
Twelve experiments (each in triplicate) were carried out according to the experimental design and the results were analyzed by Minitab 16 software. According to the Pareto chart and ANOVA (Table 1 and Fig. 1), enzyme concentration (P=0.013), extraction time (P = 0.008), and liquid-to-solid ratio (P = 0.046) had a positive effect. On the other hand, according to the results obtained from the investigated experimental domain, ultrasonic power (P = 0.612), extraction temperature (P = 0.220), and pH (P = 0.283) had no significant effect on the extraction yield and were kept constant for further analysis. In particular, to improve economic efficiency, the extraction temperature and ultrasonic power were selected as 30℃ and 200W, respectively. In addition, the pH was fixed at 5.0 so that the reaction conditions were relatively mild.
Figure
1.
Standardized Pareto chart showing the effects of 6 independent factors on TFP yield
According to the PBD results, the steepest ascent tests were designed for enzyme concentration, extraction time, and liquid-to-solid ratio, with step sizes of 0.5, 5 and 5, respectively. These factors were selected to identify the best response region.
As shown in Table 3, the highest TFP yield of 2.79% was achieved under the following conditions: enzyme concentration of 2.5%, extraction time of 35min, and liquid-to-solid ratio of 25mL/g. Hence, these conditions were set as the center point of the RSM, based on which the response surface optimization tests were designed.
Table
3.
Experimental design and response value of path of steepest ascent
3.3
Box-Behnken design and response surface methodology
The BBD and RSM were used to further examine and refine the optimal levels of enzyme concentration, extraction time, and liquid-to-solid ratio, respectively, required to produce TFP. The low and high levels for each factor were coded, as shown in Table 2. The quadratic polynomial regression equation referring to the three independent variables is as follows:
where Y (%) is the predicted response of TFP yield, and X1, X2, and X3represent enzyme concentration, extraction time, and liquid-to-solid ratio, respectively.
The ANOVA, lack-of-fit, and adequacy of the model are indicated in Table 4. The model's F-value of 167.68 implied that the model was significant (P < 0.0001), indicating that there was only 0.01% chance that the model's F-value could occur due to noise. Lack-of-fit was used to check the fitness of the polynomial model. In this study, P = 0.1412 indicated that the model was statistically insignificant; therefore, it was adequate for the prediction of TFP yield within the range of the examined variables. The determination coefficient (R2) and the adjusted determination coefficient (Radj2) were 0.9954 and 0.9894, respectively, which showed a good agreement between the experimental and predicted values of the TFP yield with goodness-of-fit of the regression equation.
Table
4.
Results of ANOVA and regression analysis of a full second-order polynomial model for optimization of TFP yield
Source
Sum of Squares
Mean Square
F Value
P-value
Significant
Model
9.85
1.09
167.68
< 0.0001
***
X1
6.00
6.00
918.96
< 0.0001
***
X2
0.27
0.27
41.38
0.0004
**
X3
0.067
0.067
10.24
0.0151
*
X1X2
0.0092
0.0092
1.41
0.2742
X1X3
0.055
0.055
8.47
0.0226
*
X2X3
0.065
0.065
9.98
0.0159
*
X12
0.35
0.35
53.77
0.0002
**
X22
1.85
1.85
282.71
< 0.0001
***
X32
0.88
0.88
134.35
< 0.0001
***
Residual
0.046
0.0065
Lack of Fit
0.032
0.011
3.27
0.1412
♦
Pure Error
0.013
0.0033
Cor Total
9.90
R-Squared
0.9954
Adj R-Squared
0.9894
Pred R-Squared
0.9454
Adeq Precision
34.815
Notes: *, ** and ***represent P < 0.05, P < 0.01, and P < 0.0001, respectively; ♦ represents "not significant."
The P-value is used as a tool to check the significance of each coefficient, which in turn may indicate the pattern of the interactions between the variables. In this case, as shown in Table 4, X1, X2, X3, X1X3, X2 X3, X12, X22 and X32 were significant model terms for the TFP yield (P < 0.05). The other terms were considered non-significant (P > 0.05).
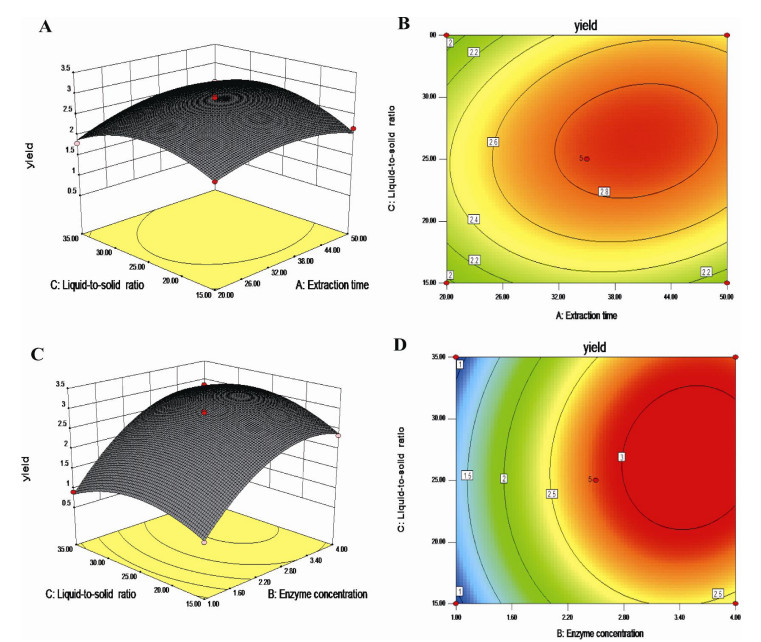
The graphical representations of the regression Eq. (5), and the contour plots are presented in Fig. 2. Two variables within the experimental range were depicted in one 3D surface plot, while the other variable was kept constant at the zero level. As shown in Fig. 2a and Fig. 2b, the TFP yield increased with an increase in extraction time (X2) from nearly 20 to 40.78 min; however, beyond 40.78 min, the TFP yield decreased with increasing extraction time as a longer time may increase the degradation of polysaccharide. When the extraction was set, the extraction yield of TFP was also found to increase with an increase in liquid-to-solid ratio (X3) from nearly 15 to 27.07 mL/g, and then decreased with a continuous increase in the liquid-to-solid ratio. Fig. 2c and Fig. 2d indicate that the extraction yield of TFP increased rapidly when the enzyme concentration (X1) increased from nearly 1.0 to 2.78, and then began to decrease.
Figure
2.
Response surface plots (a, c) and contour plots (b, d) showing the effects of variables (X1: enzyme concentration, %; X2: extraction time, min; X3: liquid-to-solid ratio) on extraction yield of TFP(Y)
3.4
Optimization of extraction parameters and validation of the model
It could be concluded that the optimal extraction conditions of TFP were enzyme concentration of 2.78%, extraction time of 40.78 min, and liquid-to-solid ratio of 27.07 mL/g, and the model predicted a maximum response of 3.11%. Considering the feasibility of the practical process, the optimal conditions were amended as follows: enzyme concentration of 2.8 %, extraction time of 41 min, and liquid-to-solid ratio of 27 mL/g.
To ensure that the predicted result was not biased toward the practical value, the suitability of the model equation for predicting the optimum response values was tested by confirmation experiments. A mean value of 3.08%±0.12% (n = 3) was obtained from the actual experiments, which demonstrated the validity of the RSM model and indicated that the model was adequate for the extraction of TFP.
4.
Discussion
The ultrasound-assisted enzymatic extraction, an effective and efficient extraction technology, is widely applied to improve the extraction yield [16]. In this study, the ultrasound-assisted enzymatic extraction procedure for the polysaccharides of Turpiniae Folium was studied and optimized, and RSM based on a two-level six-factor BBD was employed to optimize the extraction conditions including enzyme concentration, extraction time, liquid-to-solid ratio, ultrasonic power, extraction temperature, and pH.
RSM was successfully applied to study and optimize the TFP extraction process conditions and obtain the maximum total polysaccharide yield of TF. The optimum extraction conditions for the TFP yield are as follows: enzyme concentration of 2.8 %, extraction time of 41 min, and liquid-to-solid ratio of 27 mL/g. Furthermore, under the optimized conditions, the yield obtained from the confirmation experiments (3.08%) agreed well with the model-predicted yield (3.11%), demonstrating that the RSM model is efficient and successful for the extraction of polysaccharides from TF.
In summary, this study provided an optimal extraction procedure for TFP, and may expedite and provide insights into further production, development, and application of polysaccharides from Turpiniae Folium (Shan Xiang Yuan Ye, 山香圆叶).
Acknowledgments
We thank for the funding support from the National Natural Science Foundation of China (No. 81503041) and Project Foundation of Changsha Science and Technology Bureau (No. kq1701073).
WANG C, SHI S, CHEN Q, et al. Antitumor and Immunomodulatory Activities of Ganoderma lucidum Polysaccharides in Glioma-Bearing Rats. Integrative Cancer Therapies, 2018, 17(3): 674-683. doi: 10.1177/1534735418762537
[2]
LI S, SONG Z, LIU T, et al. Polysaccharide from Ostrea rivularis attenuates reproductive oxidative stress damage via activating Keap1-Nrf2/ARE pathway. Carbohydr Polym, 2018, 186: 321-331. doi: 10.1016/j.carbpol.2018.01.075
HE X, FAN X, FENG W, et al. Incorporation of microfibrillated cellulose into collagen-hydroxyapatite scaffold for bone tissue engineering. International Journal of Biological Macromolecules, 2018, 115: 385-392. doi: 10.1016/j.ijbiomac.2018.04.085
ARSHAD M U, ISHTIAQ S, ANJUM FM, et al. Acute effects of different dietary polysaccharides added in milk on food intake, postprandial appetite and glycemic responses in healthy young females. International Journal of Food Sciences & Nutrition, 2016, 67(6): 715-722. http://europepmc.org/abstract/MED/27352777
[7]
WU M, WU P, WEI X. Megastigmans from Turpinia arguta. Chemistry of Natural Compounds, 2014, 50(4): 772-773. doi: 10.1007/s10600-014-1081-y
[8]
COMMITTEE C P. Chinese Pharmacopoeia (Ⅰ) 2015, China Medical Science Press, 2015, 29-30. Chinese.
LIU X, ZHAN H, QIAO Z, et al. Chemometric analysis based on HPLC multi-wavelength fingerprints for prediction of antioxidant components in Turpiniae Folium. Chemometrics & Intelligent Laboratory Systems, 2016, 152: 54-61. http://www.sciencedirect.com/science/article/pii/S0169743916000071
[11]
ZHAO Z, LI J, WU X, et al. Structures and immunological activities of two pectic polysaccharides from the fruits of Ziziphus jujuba Mill. cv. jinsixiaozao Hort. Food Research International, 2006, 39(8): 917-923. doi: 10.1016/j.foodres.2006.05.006
[12]
DUBOIS M, GILLES K A, HAMILTON J K, et al. Colorimetric method for determination of sugars and related substances. Analytical Chemistry, 1956, 28(3): 350-356. doi: 10.1021/ac60111a017
[13]
WANG H, LI Y, REN Z, et al. Optimization of the microwave-assisted enzymatic extraction of Rosa roxburghii Tratt. polysaccharides using response surface methodology and its antioxidant and α- d -glucosidase inhibitory activity. International Journal of Biological Macromolecules, 2018, 112: 473-482. doi: 10.1016/j.ijbiomac.2018.02.003
[14]
CHEN H, NIU J F, QIN T, et al. Optimization of the medium for Lactobacillus acidophilus by Plackett-Burman and steepest ascent experiment. Acta Scientiarum Polonorum Technologia Alimentaria, 2015, 14(3): 227. doi: 10.17306/J.AFS
LIU Y, GONG G, ZHANG J, et al. Response surface optimization of ultrasound-assisted enzymatic extraction polysaccharides from Lycium barbarum. Carbohydrate Polymers, 2014, 110(38): 278-284. http://www.ncbi.nlm.nih.gov/pubmed/24906756


 DownLoad: